To Everything, Churn, Churn, Churn
How Churn Became Streaming TV’s Biggest Surprise and Biggest Problem
In the grand tradition of windowing in media, starting December 2023, all my writing will be posted first on my Substack, The Mediator, and posted on Medium one week later.
Sign up for free to get The Mediator delivered to your inbox “day-and-date”!

In recent months it’s become clear that the streaming business is tougher than a lot of people thought. (For a sense of how thinking about streaming profitability has evolved, see One Clear Casualty of the Streaming Wars: Profit, Is Streaming a Good Business? and Media’s Shift from Growth to Optimization.)
One of the main culprits is churn. It is much higher than many expected, it’s going up (Figure 1) and it might not be easy to tame. Although none of the streamers disclose it, churn may be the industry’s biggest problem.
For this essay, the good people at leading subscriber analytics provider Antenna gave me data to dig deeper into churn. Below, I discuss why churn is so critical to profitability; why it caught the industry by surprise; whether churn is becoming an ingrained consumer behavior; and what the streamers can do about it.
Tl;dr:
- How important is churn? Stubbornly high churn could render streaming permanently unprofitable for some streamers — even at scale.
- That’s because high churn both lowers the equilibrium subscriber base and increases maintenance marketing costs. For some streamers, maintenance marketing (or churn replacement) may chew up 1/2 of ARPU.
- The ease of churn may also undermine the industry’s collective efforts to improve profitability. Raising prices and moderating the pace of content spend will be pushing on a string if consumers respond by churning even faster.
- It challenges longstanding industry practices too. For instance, many sports rights contracts are predicated on generating affiliate fee surcharges all year, for content that is only on for weeks or months.
- The problem is urgent. A growing proportion of consumers are apparently becoming habituated to churning, depending on what content is available.
- As evidence, below I show previously unpublished data from Antenna on the 12-month “resubscribe” rate (people who resubscribe after having canceled within the prior year). For Netflix, in recent months over 40% of its gross additions are “resubscribers” who had canceled within the prior year. For Disney+, HBO Max and Hulu, about 30% of gross adds each month are resubscribers.
- What can the industry do? I discuss the importance of bundles (including the distinction between “good” and “bad” bundles); annual pricing plans; tailoring content strategy and scheduling around churn mitigation; and the potential benefits of loyalty and rewards programs.
- Churn is pressuring streaming economics in a way that many didn’t expect. The industry needs to adapt business models and practices specifically intended to combat it.
Figure 1. Streaming Churn Has Been Rising Recently
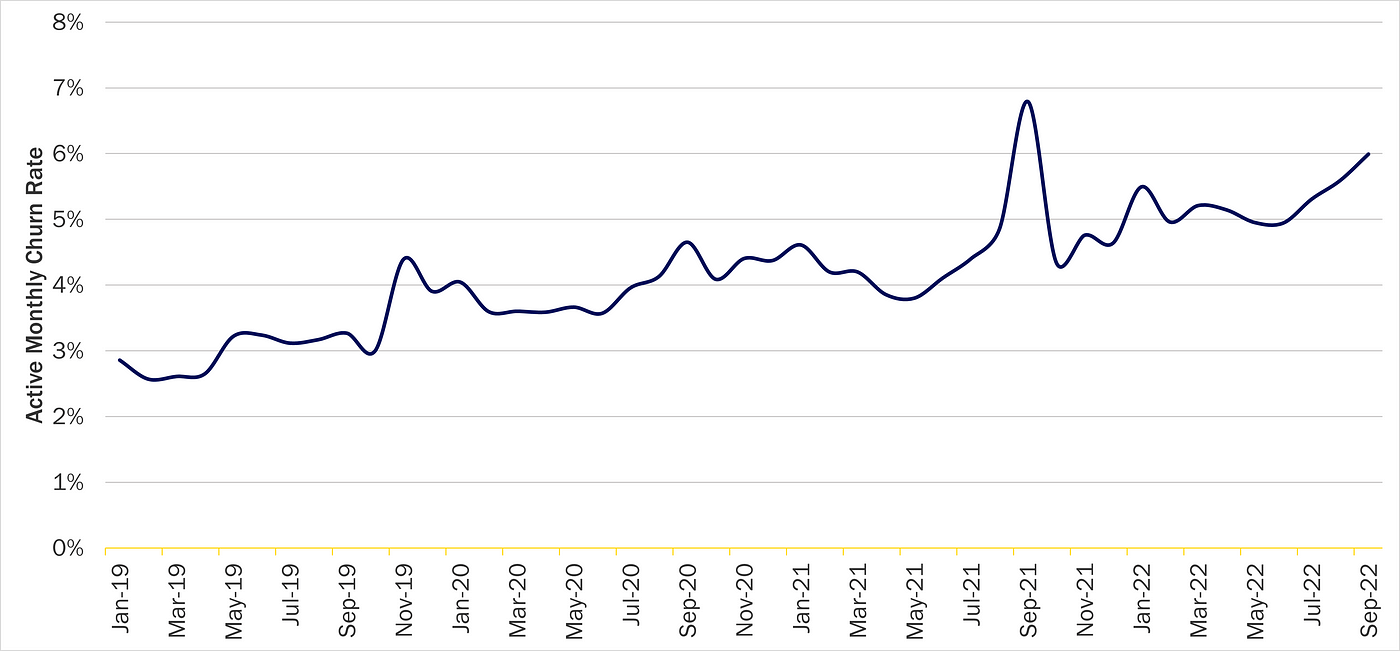
Note: Subscriber-weighted average of Apple TV+, Discovery+, Disney+, HBO Max, Hulu (SVOD), Netflix, Paramount+, Peacock, Showtime and Starz. US only; excludes Free Tiers, MVPD & Telco Distribution, and select Bundles. Source: Antenna.
Why Churn is Such a Big Deal
What follows is a bunch of words and charts. But I don’t want to bury the lede: stubbornly high churn may render streaming permanently unprofitable for some streamers, even at scale. Although streaming is currently unprofitable for the big media companies, most expect it will become profitable as the business matures. If churn stays high this may prove wrong.
Stubbornly high churn may render streaming permanently unprofitable for some streamers
What is churn? There is no standard definition, but “churn rate” is usually defined as the proportion of subscribers that disconnect per month. Antenna defines it as “cancels in a given month divided by subscribers at the end of the previous month.”
Figure 2 shows reported churn rates for a handful of companies that disclose churn publicly. Notably, none of the major streamers do, even though it is critically important.
Figure 2. Selected Publicly-Disclosed Churn Rates

Note: Spotify from June 2022 Investor Day, others from recent quarterly report. Source: Company reports.
Churn May Undermine Industry Efforts to Improve Profitability
Lately, the industry has taken collective (albeit uncoordinated) steps to improve streaming profitability. This includes price increases, introducing advertising and some signs of a moderation in the growth of content spend.
In the traditional pay TV business, consumers had little choice or recourse when distributors jammed more networks into the bundle and raised prices or ad loads went up. The ease of churning, however, gives consumers the power to undermine these efforts. If price increases and fewer new big budget shows just result in even higher churn, the industry may end up pushing on a string.
The industry may collectively agree it wants to be more profitable, but consumers may not oblige
All Else Equal, Higher Churn Means a Lower Sub Base
All things equal, higher churn means fewer subs. This point might seem obvious, but I think it’s helpful to discuss the math.
Figure 3. Netflix U.S. Subscriber Base
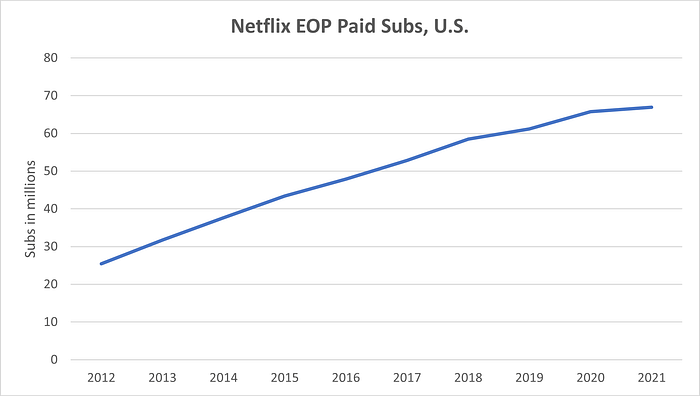
Note: Netflix reported U.S. subscriber data until 3Q19 and now reports U.S. and Canada together (UCAN). Figures from 2019 on assume U.S. represents about 90% of UCAN totals. Source: Company reports, Author estimates.
I’ll use Netflix to illustrate. As shown in Figure 3, assuming that around 90% of Netflix’s reported U.S. and Canada (UCAN) subs are in the U.S., Netflix has grown its U.S. sub base at a healthy clip over the past decade or so, from around 25 million subscribers in 2012 to around 67 million by the end of 2021.
So, we have a decent estimate of net additions each year. To state the obvious, however, annual net additions are a function of gross additions less disconnects (or cancels, or churn, whatever you want to call it). The industry’s practice of only reporting total subscribers masks the enormous amount of gross connect and disconnect activity that is constantly occurring.
The industry’s practice of only reporting total subscribers makes it easy to forget that there is tremendous connect and disconnect activity going on under the surface
But we can estimate the gross additions and disconnects too. Let’s start with churn. Netflix has not reported a monthly churn rate since 2011, when it was 4.9%. Antenna estimates that Netflix’s domestic churn rate was 1.9% and 2.0% in 2020 and 2021, respectively, and has popped up to 3.3% so far in 2022. Assuming a relatively steady rate of decline between 2011 and 2020, the time series of Netflix’s domestic churn rate would look something like Figure 4.
Figure 4. Netflix’s U.S. Churn Rate Has Been Trending Down for Years, But Has Picked Up Lately
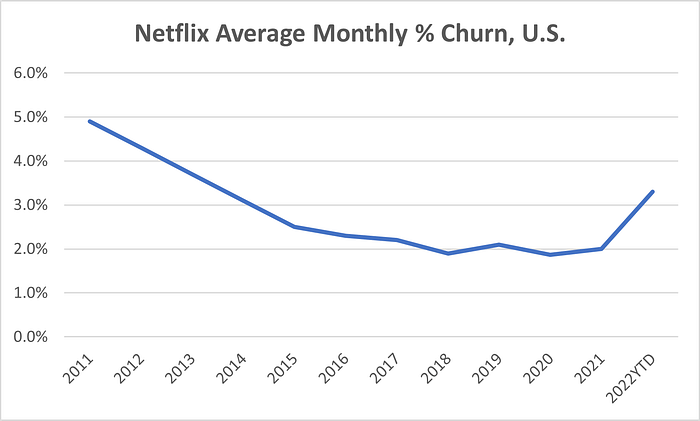
Note: Netflix last reported churn in 2011. Figures for 2020 on are Antenna estimates. Source: Company reports, Antenna, Author estimates.
With estimates of net additions and churn rate in hand, we can now estimate Netflix’s gross additions and disconnects each year (Figure 5).
Figure 5. Netflix Gross Additions Have Been Bouncing Around 18 million for Years

Source: Company reports, Author estimates.
An important observation from Figure 5 is that Netflix’s domestic gross additions were relatively steady between 2013–2021, at about 17–18 million per year. Why is this important? Because once both gross adds and churn rate stabilize, that will dictate where the sub base stops growing — i.e., the size of the equilibrium subscriber base — even years in advance.
Once both gross adds and churn for a service stabilize, it is possible to predict the equilibrium size of its subscriber base, years in advance
The reason for this is that if the churn rate is steady, the aggregate number of disconnects will grow proportionately as the subscriber base grows. If the number of gross adds is also steady, then at some point the subscriber base will be big enough that the churn on this base completely offsets the gross additions. That’s when the sub base will stop growing.
This is shown in Figure 6. For example, if you had known in 2013 that Netflix gross additions would stabilize at around 18 million per year and the churn rate would settle out around, say, 2.2% monthly (or roughly 26% annually), then you could’ve predicted almost a decade ago that Netflix’s domestic sub base would hit equilibrium at about 68 million subscribers.
So, this chart illustrates one reason churn is so important: all else equal, a higher churn rate means a lower equilibrium subscriber base.
Figure 6. The Higher the Churn, the Lower the Equilibrium Sub Base
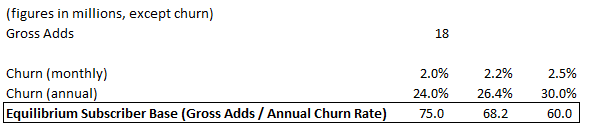
Source: Math
Here’s another way to think about it. For years, Netflix has talked about a 60–90 million subscriber total addressable market (TAM) in the U.S. As shown in Figure 5 above, I estimate that while Netflix added about 1 million subscribers in the U.S. last year, it had about 17 million gross adds and 16 million disconnects. Assuming that all of these 16 million households were unique (i.e., no Netflix household disconnected and signed up more than once in the year, which is probably somewhat unrealistic), that would mean 83 million unique households were Netflix subscribers at some point in 2021 — pretty close to the top end of the TAM range.
Including annual disconnects, Netflix is already at the top end of its projected TAM
Churn Is Very Expensive
All that connect and disconnect activity also lower returns and margins.
Mathematically, the inverse of the churn rate is the average amount of time that a customer sticks around, or “customer life” (average customer life = 1/churn rate). For instance, for a service with 2% monthly churn, the average customer life is 1/.02 = 50 months. To see why this is true, you can take a spreadsheet, start with 100 customers and reduce them by 2% each month. Although you would never fully deplete the sub base (something, something Zeno’s paradox), you would see that the weighted average customer lifetime converges on 50 months in the limit (Figure 7). Or see here for a mathematical proof.
Figure 7. Churn Determines Customer Life
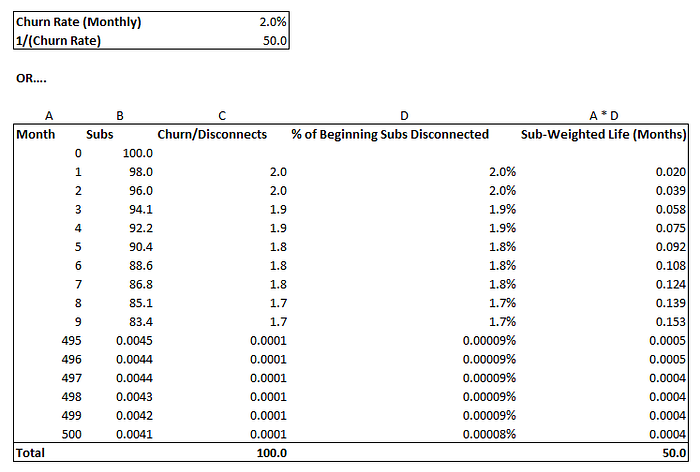
Source: Math.
Figure 8. On Average, Streaming TV Subs Don’t Stick Around Long

Note: US only; excludes Free Tiers, MVPD & Telco Distribution, and select Bundles. Source: Antenna, Author estimates.
Figure 8 shows Antenna’s churn estimates for each of the primary premium SVOD services so far in 2022 and the implied average customer life for each. On average, most streaming subs don’t stick around long — for most services it is somewhere between one and two years.
For anyone who has ever done a CAC/LTV (customer acquisition cost/customer lifetime value) calculation, it is self evident that, again all things equal, a shorter life reduces the ROI of acquiring a customer.
Another way of assessing the cost of churn is to evaluate its impact on steady-state subscriber unit economics. One can think of the monthly amortization of the SAC over the life of the subscriber as maintenance marketing costs.
Again, Netflix is a good example. Netflix no longer breaks out its expenses by region, but assuming that its marketing expenses are distributed among its regions roughly pro rata with revenue contribution and using Antenna’s churn data, I estimate that Netflix’s SAC in UCAN was about $40 per gross addition through the first nine months of 2022 (Figure 9).
Figure 9. Netflix’s SAC in UCAN was About $40 Through the First Nine Months of 2022, or A Little Over $1 Per Sub in Monthly Amortization
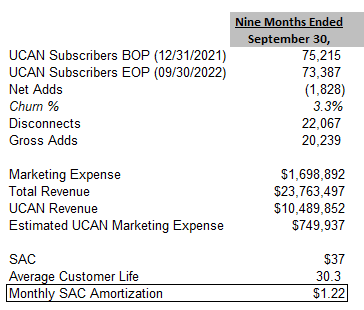
Note: Marketing costs allocated to UCAN based on UCAN percentage of total revenue. Source: Company reports, Antenna, Author estimates.
As noted above, the apparent stasis of Netflix’s subscriber base in UCAN belies a lot of gross add and disconnect activity. At 3.3% churn so far this year, the average customer life was only 30 months, meaning that to stay flat in perpetuity, Netflix has to re-acquire each customer every 2.5 years. So, we can treat the monthly amortization of the SAC, or roughly $1.25 per sub, as an ongoing cost.
It’s worth dwelling on what this implies for all the other streamers, something I discussed in detail in Is Streaming a Good Business?. It is impossible to know the SAC that HBO Max, Paramount or Disney+ incur. But it’s reasonable to assume that it is a lot more than what Netflix spends. Most streaming subscribers in the U.S. have subscribed to Netflix before, often multiple times. It has unparalleled brand recognition. It has a well-oiled marketing machine and reams of data, so it should have the most efficient performance marketing spend in the business. It follows that Netflix spends less, perhaps a lot less, to acquire each gross addition.
Also, as shown in Figure 10, Antenna estimates that the churn rates for the other streamers are much higher than for Netflix, in most cases 2X or more. Even (generously) assuming they have comparable levels of SAC, that means the monthly amortization of SAC is also 2X+, or ~$3 per subscriber monthly. For streamers that have average revenue per user (ARPU) in the high single digits (Figure 11), this means maintenance marketing costs may chew up 1/3 to 1/2 of revenue — before any content costs or any other operating expenses.
Churn is a huge cost for most streamers-maybe as much as 1/2 of ARPU
Figure 10. Churn of 2X+ Netflix’s Means a Monthly SAC Amortization of 2X+ Netflix’s…
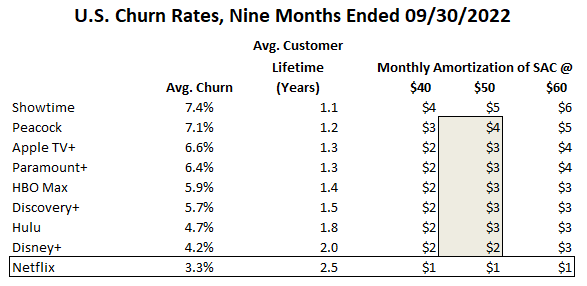
Note: US only; excludes Free Tiers, MVPD & Telco Distribution, and select Bundles. Source: Antenna, Author estimates.
Figure 11. …Which Chews Up a Large Proportion of ARPU
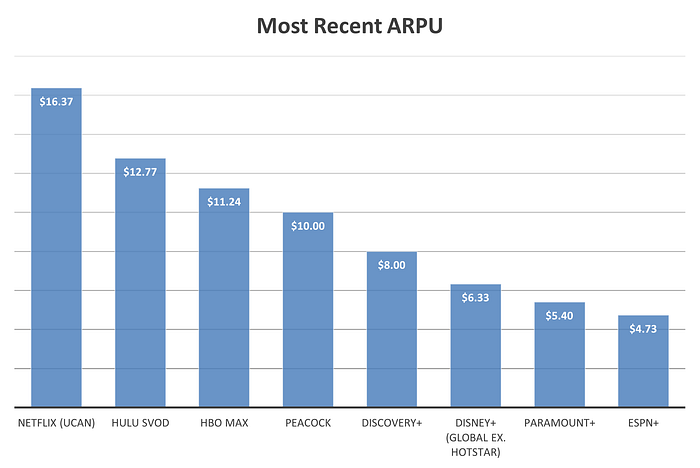
Source: Company reports, author estimates. Note: All as reported as of most recently-reported quarter, with the following exceptions: HBO Max from 1Q22 AT&T earnings report; Peacock based on commentary in Comcast 4Q21 earnings that service had 24.5MM monthly active accounts (MAA) and 9MM paying subs, with ARPU for paying subs “approaching $10” — as of 3Q22, it had 30MM MAA and 15MM paying subs; Discovery+ based on guidance last provided December 2020, assuming mix of 50/50 ad-free and ad-lite plans.
High Churn Upends Established Practices and Assumptions
Media executives have long known that pay TV was (and is) a great business model because of cross-subsidization across networks. As shown in Figure 12, as the pay TV bundle got progressively bigger, the average household still watched the same number of networks every month. People were increasingly paying for networks they didn’t consume.
Figure 12. In the Pay TV Bundle, People Paid for Networks they Didn’t Watch
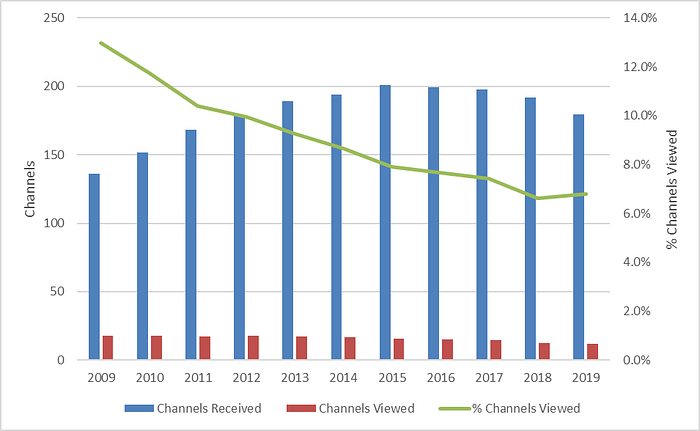
Source: Nielsen
The pay TV business benefits from cross-subsidization across networks and across time
What was perhaps less clear is that the pay TV business model also benefits from cross-subsidization across time. Programming schedules are necessarily lumpy, punctuated by major political events (the run ups to Presidential elections); high-profile TV shows (like the final season of, say, Game of Thrones); and, of course, big sporting events (the Olympics, Superbowl, NBA finals, March Madness, etc.).
When churn was low and subscribers had little choice but to take the entire pay TV bundle, TV networks were able to count on big programming investments paying dividends over time. As a result, many sports rights contracts are predicated on delivering returns long before and after the event is over.
For instance, when I was at TimeWarner, we struck a deal with the NCAA, in partnership with CBS, to carry March Madness. At the time, we publicly disclosed that we intended to seek a monthly surcharge from our distributors in the subsequent round of affiliate negotiations to generate a return on this contract. In other words, a big part of the rationale for the investment was that we would get paid all year for programming that only aired for one month. If consumers are prone to churn on and off based on when high-profile programming airs it erodes the economic foundation of these limited-run events.
Many sports rights contracts are predicated on getting paid elevated affiliate fees for a full year, for programming that’s only on for a few months or even weeks
The Root of Higher Churn: Lower Switching Costs
Why did churn catch the industry by surprise? It’s not just a matter of curiosity or history. Understanding the answer is necessary to arrest the problem.
It happened because of much lower “switching costs,” the costs to cease using a product or service. One of the defining characteristics of the Internet is that it has shifted power to consumers, in the form of greater competition (as it has reduced entry barriers), easier price discovery and lower switching costs. Streaming is no different. But while it has long been clear that streaming has much lower switching costs than traditional pay TV, it was impossible to predict with precision how this would effect churn. Turns out that it effects it a lot.
There are many types of switching costs and several taxonomies for categorizing them, but the simplest way to think about them is probably in two categories: positive and negative switching costs. By “positive” and “negative,” I mean the emotions these costs engender in customers about the service provider. Positive switching costs are the reasons you’d regret no longer subscribing, negative switching costs are the things you hate about the cancelling process.
- Positive switching costs are the opportunity costs, or foregone benefits, of dropping the service. These can include the direct benefits provided by the service (“I like the content”) or indirect benefits, such as the social value of interacting with other users; the perceived status of patronizing a certain brand; or the cost of abandoning earned status or loyalty rewards.
- Negative switching costs may be inherent to the product or service or may be intentionally intended to make it hard to cancel. They include the procedural costs of cancelling (like needing to wait for a truck roll, submit paperwork or navigate many computer prompts to speak to a human); long-term contracts with stiff penalties; sunk investments in complementary goods and services; and sunk investment in learning to use the service.
Historically, pay TV churn was very low, approximating move churn (the rate at which people move homes). That’s because the switching costs are so high. When you cancel your pay TV service, you either need to call up customer service and wait for a technician or disconnect your set-tops yourself and return them. If you’re moving to a new provider, you also need to wait for an installer to show up. It’s a huge pain in the neck. Or somewhere else. (When you move, however, you have no choice but to go through this process, which is why churn approached move churn.)
Both positive and negative switching costs for streaming are much lower than they are for pay TV. The opportunity costs to cancel any individual streaming service are lower when they all aren’t packaged together in one take-it-or-leave-it bundle and the procedural costs are very low — you can cancel with just a few clicks.
Both positive and negative switching costs for streaming are much lower than they are for pay TV
Are Consumers Becoming Habituated to Churning? Seems Like It
How hard will it be to fix the problem? Might churn even start to decline organically as streaming matures? Recall that pay TV penetration in the U.S. is still over 60%, so most streaming households are using streaming services to supplement traditional pay TV. Maybe as more homes transition to streaming-only they will churn less often?
Unfortunately, this is just wishful thinking. Replicating a chart I showed above, over the last few years churn has been climbing on a subscriber-weighted basis, not declining, even as more people have cut the pay TV cord (Figure 13).
Figure 13. Streaming Churn Has Been Rising Steadily
Note: Subscriber-weighted average of Apple TV+, Discovery+, Disney+, HBO Max, Hulu (SVOD), Netflix, Paramount+, Peacock, Showtime and Starz. US only; excludes Free Tiers, MVPD & Telco Distribution, and select Bundles. Source: Antenna.
There is also growing circumstantial evidence that churn is becoming an ingrained consumer behavior. There are a few ways to triangulate on this conclusion. With the help of The Wall Street Journal, earlier this year Antenna published a “content cohort analysis,” which shows that the people who sign up around big content releases churn quickly. As shown in Figure 14, half of the the customers who signed up around events like Hamilton on Disney+ and WW84 on HBO Max were gone in six months.
Figure 14. About Half of Subs Who Sign Up Around These Big Content Releases are Gone After Six Months
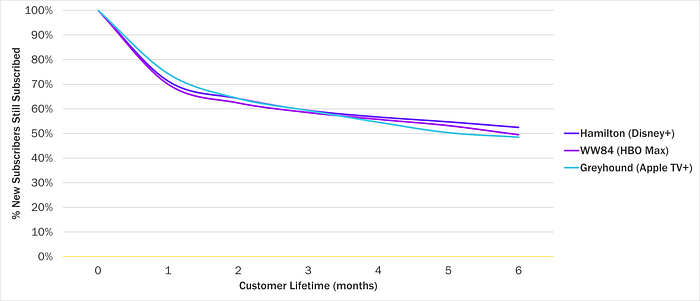
Note: Subscribers who signed up within three days of release, including trial non-converts. US only; excludes Free Tiers, MVPD & Telco Distribution, and select Bundles. Source: Antenna.
Antenna has also published data, again with the WSJ, on what it defines as “serial churners.” These are subscribers who have disconnected three or more services in the past two years. As shown in Figure 15, that figure continues to climb.
Figure 15. The Proportion of Subs Who Have Canceled Three or More Services in the Prior Two Years — “Serial Churners” — Keeps Going Up

Note: US only; excludes Free Tiers, MVPD & Telco Distribution, and select Bundles. Source: Antenna.
“Serial churners” is an interesting data point, but it’s not clear whether this increase reflects an emerging consumer behavior or just the increase in streaming services over the last several years. Disney+, HBO Max, Peacock and Paramount all launched between 2019–2021, so it’s understandable that a growing proportion of subscribers have canceled multiple services. This metric also doesn’t indicate whether these homes are churning on and off the same service repeatedly or moving from service to service.
To better understand how common it is to churn on and off the same service, I asked Antenna to provide data that it hasn’t released publicly before: the 12-month resubscribe rate. This is defined as the proportion of gross additions for any service in a given month who are resubscribing to that service after having canceled within the prior 12 months. By definition, it shows the people who are churning on and off a service at a relatively frequent pace. As shown in Figure 16, for many services the resubscribe rate is very high, and climbing. For Netflix, in recent months over 40% of its gross additions had canceled within the prior year. For Disney+, HBO Max and Hulu, about 30% of gross adds each month are “resubscribers.”
In recent months, over 40% of Netflix’s gross adds were customers who had canceled within the prior year
Figure 16. The “Resubscribe Rate” Is High and Climbing
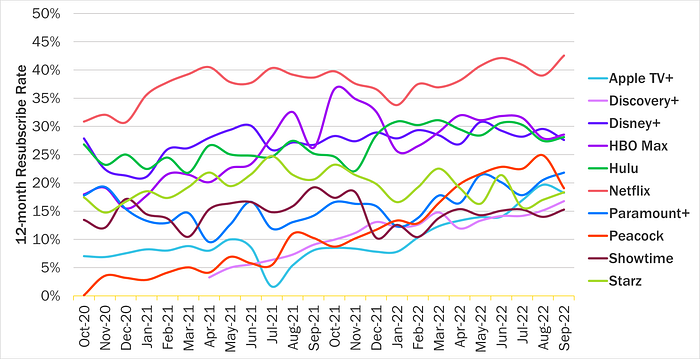
Note: Reflects the proportion of gross additions in any given month that canceled within the prior 12 months. US only; excludes Free Tiers, MVPD & Telco Distribution, and select Bundles. Source: Antenna.
Taken together, these data points strongly suggest that a growing proportion of streaming subscribers are becoming accustomed to churning on and off to manage their streaming spending, probably correlated with when specific content is available.
What Can the Industry Do?
For all the reasons cited above, taming churn should be job #1. Contrary to wishful thinking or what might be hard-coded into row 72 of some corporate Excel model, the problem doesn’t seem likely to magically cure itself.
What to do? Above, I drew the distinction between positive and negative switching costs. For businesses that have structural negative switching costs, it may be possible to intentionally raise these gates in ways that may be tough for consumers to discern. (For instance, long wait times to get an appointment or large windows of time when the technician may show up.) But transparently making it a lot harder to cancel is sure to piss people off.
Instead, the industry needs to focus on positive switching costs, i.e., creating more reasons that people want to stick around. There is no silver bullet, but a combination of the following, some of which is already in the works, may help:
Bundles, Bundles, Bundles
The heart of the TV industry’s problem is that streaming is unbundling the pay TV bundle. The obvious solution? Re-bundle! But this raises a question: don’t consumers hate bundles?
If you’re wonkish enough to have made it this far, I recommended reading Four Myths of Bundling by Shishir Mehrotra, which provides a good general framework for thinking about bundles. One of Mehrotra’s contentions (Myth#3/Thesis#3) is that consumers like bundles when they can see the discount for the bundle relative to the a la carte price for the components. So, we can define two kinds of bundles: “bad” (or forced) bundles, in which it isn’t possible to buy the components individually (like cable TV or the newspaper) and “good” (or voluntary) bundles, in which it is.
Bad bundles reduce churn because they offer all or nothing, so the opportunity cost of dropping the bundle is forgoing the benefits of all of the components. Good bundles provide consumers more choice when contemplating canceling: they can drop the entire bundle or downgrade to one or several components. Good bundles reduce churn because, just like a bad bundle, canceling the entire bundle incurs the opportunity cost of losing access to all the components, while downgrading to one or more components requires forgoing the bundled discount. But because consumers perceive there to be limited choice in bad bundles, they elicit bad will. Good bundles both provide choice and make the benefit of bundling explicit. They engender goodwill.
Bad bundles engender bad will, good bundles elicit goodwill
The Disney streaming bundle is a good example of a good bundle. After Disney+ introduces ads (and raises prices on its ad-free tier) next month, the a la carte monthly price of Disney+ (with ads) will be $7.99, Hulu (with ads) is $7.99 and ESPN+ is $9.99, or a total of almost $28. The Disney Bundle of those components is only $12.99, or less than half the a la carte price. For a subscriber to The Disney Bundle, canceling service altogether means losing access to a lot of content and downgrading to one or two of the components makes no sense economically. On its recent F4Q22 earnings call, CFO Christine McCarthy mentioned that over 40% of U.S. Disney+ subscribers now opt for the Disney Bundle. Not surprisingly, the churn on this bundle is far lower than the churn on the individual components (Figure 17). Paramount also bundles Paramount+ with Showtime. The offer is also a good bundle but isn’t as compelling; Paramount+ (with ads) is $4.99 and Showtime is $10.99, with a bundled price of $11.99, a 25% monthly savings.
Figure 17. Churn on The Disney Bundle is Much Lower than the Components
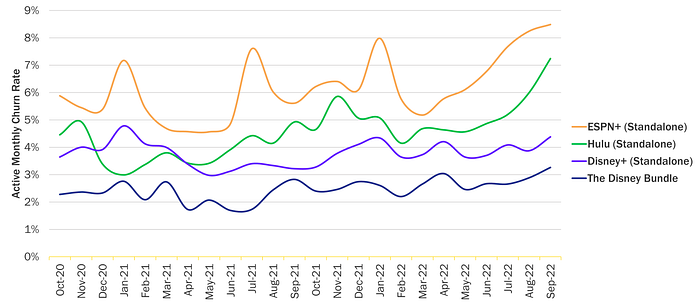
Note: US only; excludes Free Tiers, MVPD & Telco Distribution, and select Bundles. Source: Antenna.
So, what should the streamers do?
- Bundle multiple streaming products with clear a la carte prices. Providers with multiple discrete products should bundle them, with a clear a la carte price for the components and an attractive discount. WarnerBros. Discovery has announced its intentions to combine HBO Max and Discovery+ into one streaming service, launching in the spring. It hasn’t yet provided any details. But rather than roll out one broad service, I think it would make more sense to combine both services into one UI, but offer both a la carte and bundled options, with a clear and compelling bundled discount. The shuttering of CNN+ is obviously water under the bridge at this point, but adding another service with a clear a la carte price to the bundle would make it even more attractive.
- Bundle other products and services. Another contention of Mehrotra’s article is that, contrary to the perception that bundles should be narrowly constructed with similar services targeting similar consumer segments, the bigger the bundle, the better (Myth #4/Thesis #4). Disney has reportedly been contemplating a “Disney Prime” type service that packages access to the parks, exclusive merchandise and streaming services. The other streamers clearly don’t have the range of consumer offerings that Disney does, but they should all be looking to partner with other subscription services, even those that may appear far afield. It is already common practice to bundle with wireless providers (AT&T, T-Mobile and Verizon all offer one or more streaming services for free to high-end subscribers) and Walmart recently struck a deal to bundle Paramount+ with its Walmart+ service. Spotify bundles Hulu or Showtime for students. These kinds of bundles obviously carry lower ARPUs then selling direct, but there should be a way to structure them such that the combination of lower SAC and lower churn more than compensates. Expect to see more of this.
- Bundle with unaffiliated streaming services. Streaming services would benefit from re-aggregating attractive bundles with each other. The challenge so far has been how to structure these deals and share economics. Comcast and Paramount started rolling out a joint streaming service in Europe (SkyShowtime) a few months ago, so it’s possible to overcome these hurdles. Another possibility is to empower a connected device manufacturer, such as Apple or Roku, to construct and sell attractive bundles. For instance, streamers could offer a “bundled” rate card that offers a progressively larger discount the more services with which their streaming service(s) is/are bundled. Amazon’s Prime Video Channels currently offers Discovery+, Paramount+, Showtime, Starz and several other services, but offers no bundled discounts, which seems like a missed opportunity.
Attractive Annual (or Longer) Plans
Obviously, it makes sense to give consumers an economic incentive to stick around longer. Under the general dictum that consumers hate restrictions (“contract” is a four-letter word) but love choice, most streamers offer a discounted annual plan. However, the discounts are relatively small (most of them are 16–17% relative to the monthly plan), they are inconsistent (Disney offers one only for Disney+, but not for the Disney Bundle or the components) and they are not always well marketed.
Streamers should be, and likely are, evaluating whether more aggressive and better marketed annual plans make sense in light of rising churn. Recently, coincident with the launch of House of the Dragon, HBO Max offered a 40% discounted annual plan. While it might seem counterintuitive to offer such a big discount timed with the release of some of its most-anticipated programming in years, clearly HBO Max management believed that these new subscribers were prone to churn quickly.
Creating Customized Save Plans and Accommodating Frequent Churners
Pay TV distributors typically have “save desks” to which customers are transferred when they call up to cancel. These customer service reps are usually incentivized to keep people subscribing and empowered to offer them additional programming or discounts. Streamers could also offer customized (and automated) save plans when subscribers try to cancel, such as discounts or other incentives. Subscribers with many profiles or high levels of engagement might need less persuasion that those with low usage levels. The challenge, of course, is customizing them or even randomizing them in such a way that we don’t see a flood of articles titled “Looking for cheaper Netflix, here’s how!”
Another approach is accommodating frequent churners by making it easy for them to sign back up. (While this might not solve the churn problem, it could dramatically reduce the SAC to re-acquire these subs.) For instance, this might include offering to put the account on hiatus and sending an SMS monthly enabling a 1-click resubscribe.
Content Scheduling, Live Programming and Cross Marketing
Throw this one in the obvious bucket too, but I also expect to see streamers adopt more programming strategies that are geared specifically to combatting churn.
That means ensuring that tentpole programming is launching year-round. It also means getting viewers hooked on their next show. Netflix uses its recommendation algorithm and outbound email campaigns for this purpose, but those streamers who offer ad-supported plans should also use their ad inventory to cross-market other programming.
Netflix has said it remains committed to its binge release model, which builds momentum for new programming. Once shows have a strong following, however, it makes sense to release subsequent seasons on an episodic (or semi-staggered basis). For instance, Netflix broke season 4 of Stranger Things into two tranches. A middle-ground between dropping all episodes simultaneously and episodic (weekly) release, this approach keeps subscribers sticking around and the show in the zeitgeist longer.
Another approach is to invest more in live programming that compels sustained and regular viewing. Netflix also recently announced that Chris Rock will perform live early next year, its first foray into live programming. Whether viewers choose to watch a comedy special live is another matter, but programming that encourages and habituates ongoing live viewing (such as Netflix’s reported interest in sports), is another way to ensure sustained subscribership.
Loyalty Programs
Another form of positive switching cost is loyalty and rewards programs that consumers are loath to lose. This could include discounts to other products and services, like Disney’s recent discount at DisneyWorld for Disney+ subs. It could also include loyalty rewards that provide price discounts for long-time subscribers (“subscribe for one year and get your 13th month free!”) or preferred or exclusive access to content, merchandise or services.
Churn Demands Attention
Stepping back, remember that historically most of the big media companies had limited or no direct exposure to consumers. They were largely wholesalers and didn’t have to worry about all the messy elements of dealing with people, like consumer billing, bad debt, customer support, performance marketing and, yes, retention.
But churn is a real problem that has caught just about everyone short. Unless the industry focuses squarely on fixing it, for some the streaming business may never turn a profit.