One Clear Casualty of the Streaming Wars: Profit
TV is at a Tipping Point
In the grand tradition of windowing in media, starting December 2023, all my writing will be posted first on my Substack, The Mediator, and posted on Medium one week later.
Sign up for free to get The Mediator delivered to your inbox “day-and-date”!

Tl;dr:
- There is a lot of excitement about traditional TV companies transitioning to streaming, but an unavoidable conclusion is that the streaming business is structurally much less profitable than traditional TV.
- For context, the cable networks business is one of the most profitable industries in the U.S.; it represents the vast majority of major media companies’ profits; traditional TV networks revenue growth is, for the first time, stagnating; and traditional TV is far larger than the streaming market — roughly $100 billion in TV network affiliate fees and national TV advertising last year, compared to only $19 billion in streaming subscription and ad revenue.
- Why is streaming less profitable? Starting with economic theory, unbundling digital information goods inherently reduces profits and streaming is unbundling TV.
- More quantitatively, below I show that streaming generates only 1/6 as much revenue per streaming home as pay TV generates per pay TV home for two reasons: on average, streaming homes are only subscribing to ~2 services; and half of all streaming time is ad-free. Even under optimistic assumptions about increased streaming subscription take rates and ad monetization, it is hard to see how streaming will come close.
- As another angle on the revenue impact, I show that streaming monetizes at a lower rate per hour of consumption, also implying a perpetual drag as usage continues to shift.
- Going direct-to-consumer also adds significant operating costs for traditional networks. These costs approximate the gross margin that traditional pay TV distributors retain, meaning there is little or no economic advantage in cutting out the middleman.
- Yet another source of profit pressure will be much higher churn, due to much lower consumer switching costs.
- And perhaps most damaging is the changing competitive dynamic. Not only is Netflix willing to operate at much lower margins, but other deep pocketed “new” entrants are willing to operate at no margin at all.
- Music, newspapers and magazines have all gone from growth to “ex-growth.” They’ve come out the other side, but smaller and fundamentally changed.
- Until recently, the relative resiliency of traditional pay TV and the rapid growth of streaming have obscured the inevitability that TV will go through a similar transition. But we’re on the cusp of it now. Traditional TV is, finally, rolling over, and streaming profits won’t likely be big enough to make up the difference. Many of the downstream effects are difficult to predict, but one thing is clear. The TV business will change radically.
No one heard of the phrase “streaming wars” just a few years ago. If you Google it today, you get 700,000 hits. Whether “war” is the right word is a matter of debate. Unlike a war, there won’t likely be a clear winner. But, like a war, there will be casualties. And one unavoidable casualty will be industry profits.
Everyone knows that the transition from traditional TV to streaming is not great for most traditional TV companies. Wall Street knows it, with most public TV networks companies trading around 6X next year’s EBITDA (earnings before interest, taxes, depreciation and amortization), near historical lows. And Hollywood knows it, as is well summarized here and here. My former colleague Kevin Reilly recently referred to this realization as “the great reckoning.”
Figuring out how not great, though, is complicated. Understanding the profit implications of this shift for traditional TV companies requires answering two questions: 1) will they maintain their share of the pie as attention and revenue shift from traditional to streaming?; and 2) at the end of the day, will the overall pie — i.e., the combined profits of traditional and streaming TV — be bigger or smaller?
The former question is easy. Other than Disney, no traditional media company has come anywhere close to retaining the same share of streaming revenue that it has in traditional TV (Figure 1). And given the dominance of Netflix, the massive push by Disney and the presence of other deep pocketed players (Amazon and Apple aren’t generating much direct streaming video revenue yet, but could), no one else likely will.
The latter question is more difficult. No one really knows what the “steady-state” margins will be on the streaming video business and no one knows the equilibrium point in the transition (the point at which traditional TV viewing and subscriber losses and streaming viewing and subscriber gains start to level off). Any precise forecast of industry profits is an educated guess, at best. But the unavoidable answer is that the total profit pie will be smaller.
In this essay, I try to outline why the streaming business will be structurally far less profitable than what it is rapidly replacing, the traditional TV networks business and, as a result, why overall (combined traditional and streaming TV) industry profits have likely peaked. Some of the reasons are well understood, others are not.
Figure 1. Other Than Disney, No Traditional TV Company is Holding Share
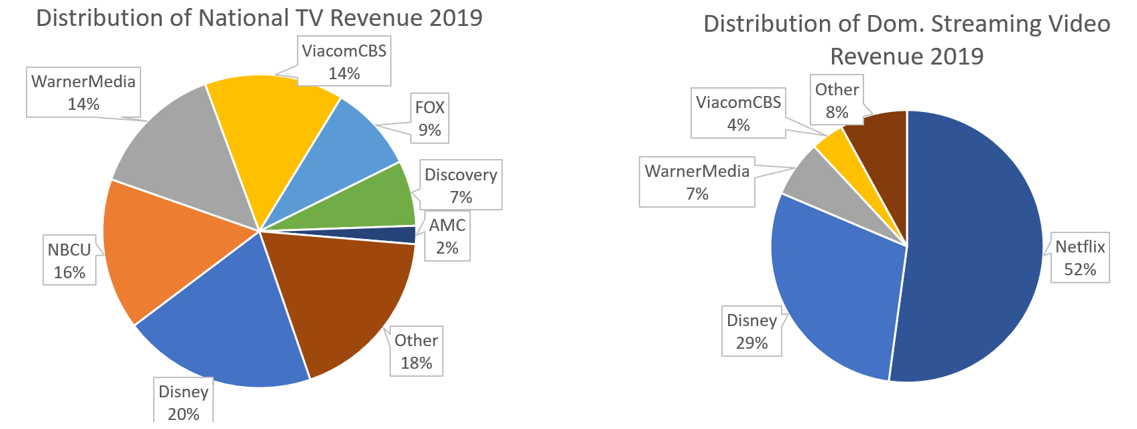
Sources: Company reports, author estimates
Some Context: It’s Been a Great Ride
Before digging into the likely impact of streaming on industry profits prospectively, it will be helpful to understand where we are now.
Foundational Point 1: Cable Networks is One of the Most Profitable Businesses Ever
The cable network business has been, and is, an unusually profitable one. As shown in Figure 2, in 2019 the cable network segments of the largest public cable network companies generated EBITDA margins of 38%, on a weighted-average basis. (While this represents margins pre-overhead, allocating corporate overhead would only reduce margins by 2–3 percentage points.) That compares to about 15% margins for the entire economy and places the industry among the most profitable in the U.S. And this is comparing EBITDA margins, not return on invested capital (ROIC). Many of the industries at the top of the EBITDA-margin pile are capital intensive (oil and gas E&P, railroads, real estate, semiconductors, etc.). When you consider the extremely low capital intensity of the cable network business, it likely generates among the highest ROIC of any industry in the U.S. It is a great business.
Figure 2. Cable Network Margins are in the Top Decile of All Industries in the U.S.
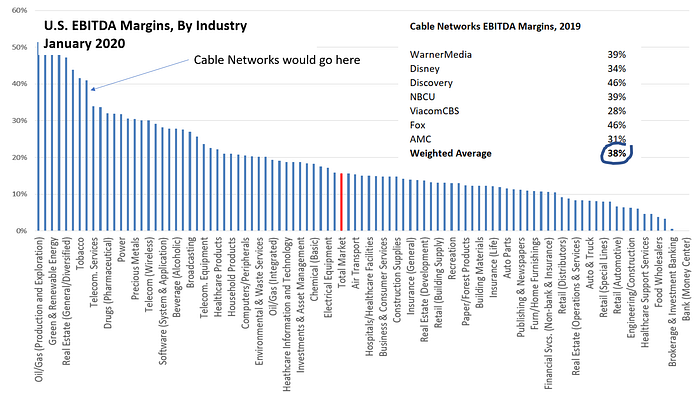
Sources: U.S. industry data from Aswath Damodaran; Company reports
Notes: Cable networks segment margins all as reported for fiscal 2019; represents segment EBITDA before corporate overhead allocation; average weighted by EBITDA.
Foundational Point 2: Cable Networks Represents a Huge Proportion of Media Conglomerate Profits
The cable networks business is the largest source of profits for the biggest traditional media companies. Figure 3 shows this proportion for each (note that this represents the proportion of profits for WarnerMedia and NBC Universal, not their parent companies AT&T and Comcast, respectively). On a weighted average basis, it represents almost 2/3 of profits. Putting it a different way, in 2019 these six companies generated about $48 billion of EBITDA before corporate overhead, of which $31 billion came from cable networks. If we instead extended our discussion to “national TV,” meaning inclusive of broadcast TV networks (ABC, NBC, CBS and FOX), which face similar effects from streaming, it would be even higher.
Figure 3. Cable Networks Represent the Majority of Profits at the Biggest Media Companies
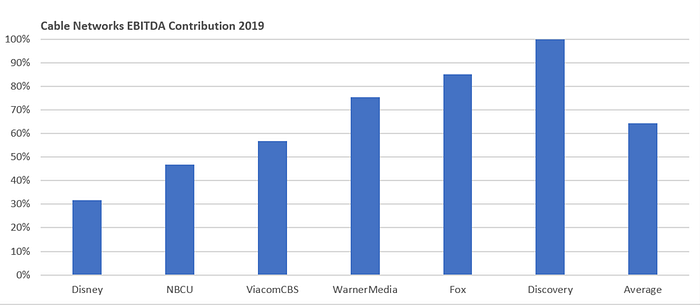
Sources: Company reports
Notes: Cable EBITDA contributions all as reported for fiscal 2019, with both Disney and Fox presented pro forma their transaction; represents segment EBITDA before corporate overhead allocation; average weighted by EBITDA.
Foundational Point 3: After Years of Premature Obituaries, Traditional TV Revenue Growth is Finally Flatlining
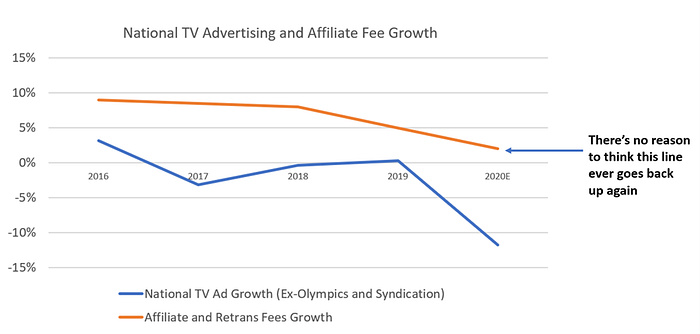
No reason to belabor this point because it is well understood, but traditional TV networks revenue growth is now, finally, approaching zero. The rise of streaming has been accompanied by countless premature predictions of the imminent demise of traditional TV, but it has continued to grow revenue and profits every year, driven entirely by affiliate fees.
TV networks revenue is split about 40/60 between advertising and affiliate fees. Advertising has been stagnant for the last few years, as CPM increases have roughly offset declines in viewership. Affiliate fees, however, have continued to grow in the mid-high single digits as pay TV subs have remained surprisingly resilient until recently (Figure 4) and affiliate rate increases have averaged in the high single digits each year.
Figure 4. Pay TV Subs Have Been Surprisingly Resilient, Until Recently
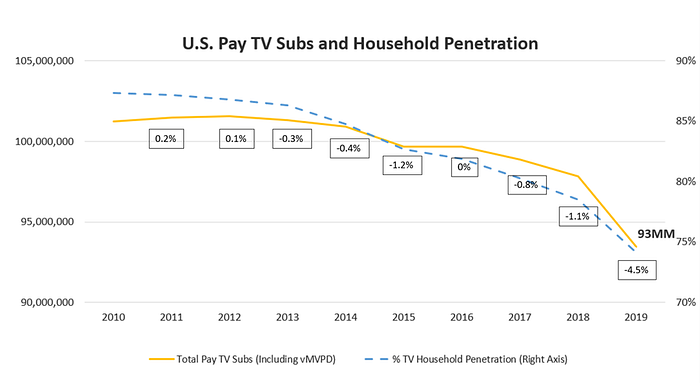
Sources: Kagan, author estimates
Figure 5. Traditional TV Networks Revenue Growth is Stagnating
Sources: MoffettNathanson, author estimates
As shown in Figure 5, however, that is now coming to an end as the affiliate fee engine runs out of gas. Affiliate fee growth has decelerated substantially over the last few years as the rate of pay TV subscriber declines picked up and TV networks lost bargaining power with distributors (which sometimes meant lower rate increases and sometimes meant giving distributors more flexibility to remove networks from the most popular packages). At the current pace, pay TV subs are set to decline 5–7% in 2020 (after declining close to 5% in 2019) and, as a result, affiliate fee growth will probably only be about 1–3%.
It is hard to determine how much of the pressure on subscriber growth this year is tied to the COVID-19 pandemic, but there are a host of other secular pressures on subscriber counts, namely: rising indifference among distributors about marketing pay TV and retaining subs as it becomes a smaller part of their business and their video gross margins continue to shrink; rising pay TV prices as distributors indifferently pass through affiliate rate increases to customers; TV networks reducing the quality of their network programming either to shift more of their premium content to their streaming offerings or just to save money; and the slow burn of demographics, with younger consumers much less likely to subscribe. So, whether the rate of subscriber declines moderates in 2021 is hard to predict, but that’s somewhat besides the point. Either way, there is little reason to think that affiliate fee growth improves much after this year and it could get worse.
Foundational Point 4: Contrary to Perception, Streaming Has Barely Grown the Pie, If At All
Now it gets a little more interesting. Not only has traditional TV revenue continued to grow despite the advent of streaming video, but it is commonly believed that streaming has grown the pie significantly. It hasn’t.
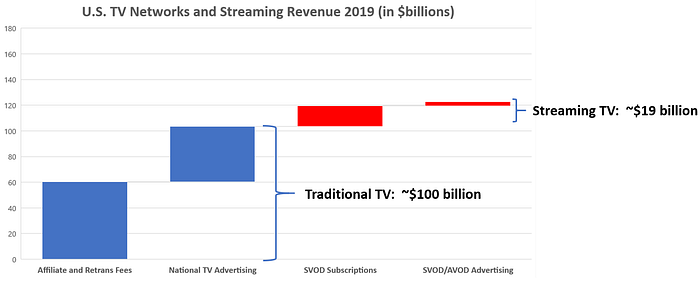
First off, let’s put the various market sizes in context. For all the mental and literal bandwidth that Netflix, Hulu, Amazon Prime, Apple TV+, Disney+, Roku, etc. occupy, the streaming video market is relatively small. As shown in Figure 6, the total market size of traditional national TV, meaning the affiliate and retrans fees paid by cable, satellite and telco distributors plus national TV advertising (national cable and broadcast, not local TV, local cable and syndication) was roughly $100 billion last year. (To be clear, this does not reflect the end market size, because it represents wholesale affiliate fees, not the retail payments consumers make to cable, satellite and telco distributors. Including that, the market size would be closer to $140 billion.) The entire streaming video business, including SVOD subscription revenues (primarily from Netflix, Hulu and a host of smaller services) and advertising revenue (from Hulu, Roku, Pluto, Tubi, etc., but excluding YouTube) was only an estimated $19 billion, or less than 1/5 the size of traditional TV.
Figure 6. Streaming Video is Less than 1/5 the Size of Traditional Pay TV
Sources: MoffettNathanson, Company reports, author estimates
Notes: SVOD subscription revenue is predominantly Netflix and Hulu, plus many smaller services. SVOD/AVOD advertising includes advertising in long-form, professionally-produced video on Hulu, Roku, Pluto and smaller AVOD providers, but excludes other digital video advertising, including YouTube.
Even if streaming is small relative to traditional TV, streaming video has added $19 billion to the pie, which is nothing to sneeze at. Right? No, sneeze away, because that overlooks the foregone revenue to traditional TV.
Let’s examine the effect on affiliate fees first. Netflix first offered streaming as a free add-on to its DVD-by-mail service in 2007. In 2010, streaming reached sufficient critical mass that Netflix split its offering into separate DVD-by-mail and streaming services. As shown in Figure 7, household penetration of pay TV (including both traditional pay TV providers and “virtual MVPDs” or “vMVPDs” like Sling, YouTube TV and Hulu Live) peaked at around 87% around that time. Without the advent of streaming video, there is little reason to think this figure would’ve changed much. If we assume that penetration had stayed flat, at about 87%, at the end of 2019 there would’ve been 110 million pay TV subs, 17 million higher than the actual tally of about 93 million. If those subs generated average revenue and, therefore, average affiliate fees, that represents over $9 billion in foregone affiliate fee revenue.
Figure 7. SVOD Has Arguably Reduced US Pay TV Subs by 17 Million

Sources: Kagan, author analysis
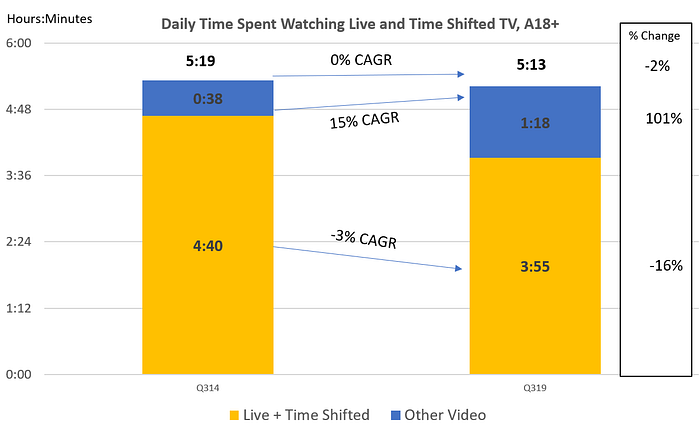
This woulda-coulda-shoulda analysis is harder to do for foregone advertising revenue. There is little debate that streaming has cannibalized traditional TV viewing. Figure 8 shows that, based on Nielsen data, for adults 18+, total video consumption (traditional TV, plus video viewing on connected devices, PCs, tablets and smartphones) is about flat over the past five years, while live plus time shifted TV, which is a proxy for traditional cable and broadcast TV, has declined about 3% per year, and “other video,” most of which is streaming, has grown at a 15% annual clip. (Note that this understates the potential impact on advertising revenue because this reflects all adults. Viewing among A18–54, which are the only demographics that advertisers buy, has experienced an even faster shift from traditional to streaming than shown here, offset by greater stability in traditional TV viewing among adults 55+.)
Figure 8. While Total Video Consumption Has Been Flat, Consumption of Traditional TV is Down
Sources: Nielsen Total Audience Report June 2014 and February 2020, author analysis
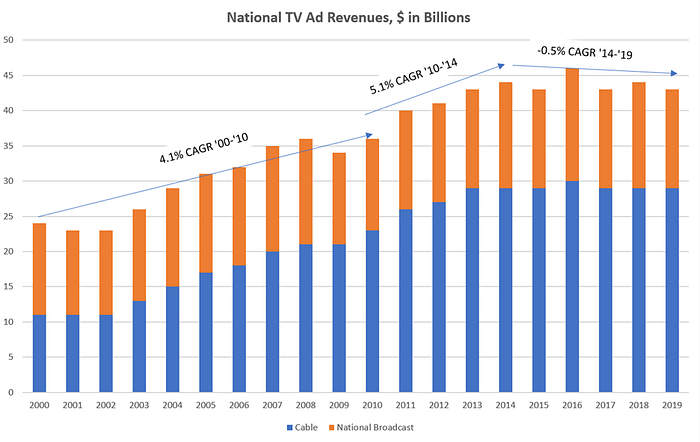
There is also little debate that TV advertising growth has slowed dramatically in the last few years. As shown in Figure 9, national TV ad revenue grew about 4% per year from 2000–2010 (a period that included the ’08-’09 recession) and 5% per year from 2010–2014. Since then it is stagnant.
It’s overly simplistic, however, to assert that TV ad revenue would’ve kept growing by 5% per year since 2014 if not for streaming. TV ad revenues are largely a function of TV ad budgets, not TV viewership. (That explains why TV ad revenues have stayed about flat even as viewership has declined and why the supposed mystery of how TV CPMs have risen even as ratings have fallen is not a mystery at all.) Ad buyers have surely shifted budgets away from TV as viewership has declined, prices have risen and the perceived ROI has declined –but not necessarily in lock step with the decline in viewership. Also, TV would’ve lost some share to digital even if Netflix had never amounted to more than a twinkle in Reed Hastings’ eye. (I write “some share” because much of Facebook and Google advertising is for small and medium businesses’ performance advertising, not the brand advertising prevalent on TV).
Even if we can’t draw a linear relationship between lost viewership to streaming and lost ad dollars, we can spitball some estimates of the impact. Each 1 percentage point reduction in the compound annual growth rate (CAGR) since 2014 reduced the size of the national TV ad market in 2019 by about $3 billion. How fast would it have grown if not for Netflix and its ilk? 1%, 2%, 3% per year? If you choose 3%, which seems reasonable, that represents another $9 billion in foregone revenue.
With $9 billion in foregone affiliate fees and a reasonable estimate of $9 billion of foregone ad revenue, the $19 billion streaming video business has barely expanded the pie at all.
Figure 9. National TV Ad Revenue Stopped Growing 5 Years Ago
Sources: MoffettNathanson, author analysis
Streaming is Structurally Less Profitable
That provides a snapshot of where we are today: the cable networks business is one of the most profitable businesses ever; it accounts for the vast majority of profits for the biggest media companies; traditional national TV revenue growth is, for the first time, approaching zero; and, contrary to perception, streaming video has not grown the pie much so far, if at all. But what about going forward? Will streaming grow the profit pool? There are fundamental reasons that it likely won’t.
An Overarching Idea: Bundling Good, Unbundling Bad
Before I get into more specific (and quantitative) reasons that streaming will be less profitable than traditional TV, here’s an overarching idea to mull over: bundling information goods inherently increases profits, so unbundling them inherently decreases profits.
Pay TV is more than a bundle; it is a bundle of a bundle of bundle of a bundle. TV episodes are bundled into series; series are bundled into networks; networks are bundled into a pay TV package; and the pay TV package itself is a bundle of content and distribution (at least when it is provided by a facilities-based distributor like Comcast or DirecTV). Thanks largely to the advent of streaming, all of these components can be purchased separately today. What is effectively at work right now is the unbundling of the TV bundle.
The assertion that unbundling inherently reduces profits may not be intuitive. Jim Barksdale once famously, and apparently half-jokingly, said that “…there’s only two ways I know of to make money: bundling and unbundling.” Clayton Christensen put more rigor around the same concept, writing in The Innovator’s Solution that “[t]he advantage…goes to integration when products are not good enough, and to…dis-integration when products are more than good enough.” In other words, bundles are attractive to customers when it is too hard for them to satisfactorily assemble the components themselves, but breaking apart the bundle is attractive to customers when the performance characteristics (and price) of the bundle overshoot what they need or want. Barksdale was right — depending on the circumstances, sometimes you make money from bundling, sometimes you make money from unbundling.
While unbundling a bloated bundle is attractive to the overserved customer and the unbundler — the party who takes market share by disrupting the bundle and offering one or more of its sub-components separately — the process of unbundling information goods necessarily reduces overall industry profits. There are two reasons for that:
- Unbundling reduces economies of scope and increases transaction costs. There will always be additional costs to sell the components separately.
- Bundling increases revenue, so unbundling reduces it. Bundling increases revenue relative to selling individual goods at the profit maximizing price because it shifts the aggregate demand curve to the right (meaning the aggregate of the demand curves for the individual goods). To see why, let’s say you have a large number of consumers, a variety of related goods, and those consumers place a wide variety of values on those goods. In the case of a newspaper, some people place a high value on some sections and little on others; some value all the sections about the same; some only read one section, etc. But even in those cases where a section has less value to a consumer than where it would be priced as a separate good, it often has some value. Or the optionality of having access to that section may hold some value. So, even though a given consumer might not buy certain sections if they were priced at the profit maximizing price, adding in all those sections adds value to the bundle, possibly a lot of value, thereby increasing willingness to pay. Unbundling, therefore, reduces demand. And since digital information goods carry almost no variable cost, reductions in revenue directly affect the profit line.
The pay TV business has been such a great business for so long because people were effectively paying for products they didn’t consume. Now that consumers have more control over what they pay for, there will likely be greater alignment between consumption and expenditure.
OK, on to the quantification of that idea…
Streaming Generates Far Less Revenue Per Streaming Household
If streaming is only 1/5 the size of traditional TV, as described above, it follows logically that it generates less revenue per streaming household than traditional TV generates per pay TV household. But drilling a little into the numbers is striking.
As mentioned above, last year the traditional TV business generated about $100 billion, compared to $19 billion for streaming. More than 90 million homes subscribed to pay TV; and based on survey data, about 100 million homes had at least one paid SVOD service and, triangulating a wide range of estimates, about 70 million homes used at least one AVOD service each month. As shown in Figure 10, that means the average pay TV home generated $90 per month of networks revenue (including affiliate fees and advertising revenue paid to TV networks, not retail revenue paid to cable, satellite and telco distributors) versus streaming generating $15 per month per streaming household.
Figure 10. Pay TV Generates About 6X per Pay TV Household What Streaming Generates per Streaming Household
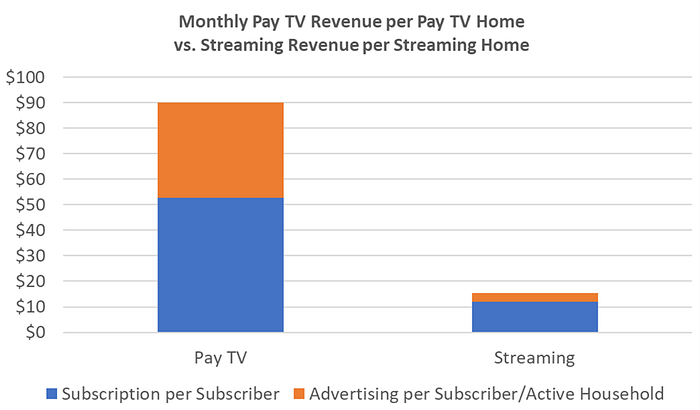
Sources: Kagan, Vorhaus, MoffettNathanson, Company reports, author estimates.
Notes: Represents affiliate fees paid to TV networks, not retail revenue paid by subscribers to cable, satellite and telco distributors.
OK, so why is that? There are two primary reasons:
1) Streaming households aren’t subscribing to that many streaming services. I had a colleague at Time Warner who, when first asked about the emerging threat from Netflix years ago, would reply “You can’t fit an $80 thing into an $8 thing!” His point was that Netflix couldn’t support the cost structure of the whole pay TV bundle. True enough. But what if a lot of people don’t actually want the full bundle? That is, of course, what’s happening now. According to Nielsen survey data, as of late last year, the average streaming household only subscribed to two streaming services (Figure 11). This figure jibes with the tops-down figures in Figure 12. As shown, inclusive of Amazon Prime (which consumers may or may not regard as something they pay for), the total number of SVOD units at the end of last year was around 230 million, which also equates to 2.3 SVOD services per SVOD home (recall that, based on survey data, about 100 million households had at least one SVOD service). With the successful performance of Disney+ this year and the launch of HBO Max and Peacock, this figure has undoubtedly crept a little higher since then. However, most SVOD services range from around $5–6 monthly (Hulu, Disney +, CBS All Access) up to $13–15 (Netflix, HBO Max). It will take a lot more than two or three of them to make up for $50+ in lost affiliate fees per household. Some households will re-create a synthetic bundle by subscribing to Netflix, Amazon, Hulu, Disney+, HBO Max and CBS All Access/Paramount Plus and others. But over a decade into the streaming revolution, the data suggests that the vast majority probably won’t.
Figure 11. The Average Streaming Household Only Subscribes to About 2 Paid Services
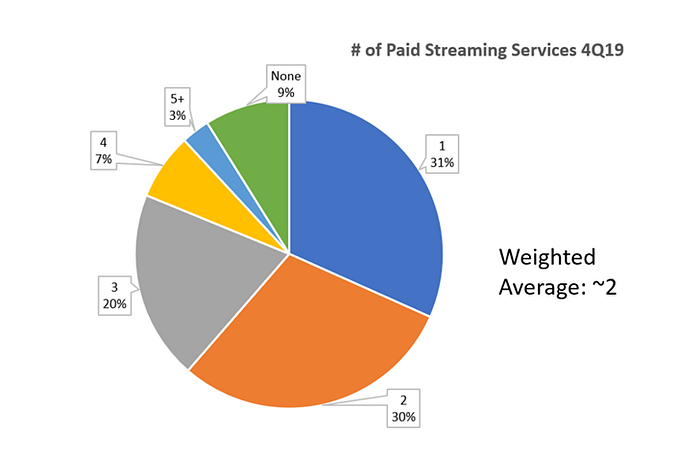
Source: Nielsen Total Audience Report February 2020
Figure 12. There Were About 200 million Streaming Subscriptions at the End of Last Year, Also Equating to About 2 Services Per Streaming Home

Source: Kagan, Amazon Prime viewers from author estimate.
2) About half of streaming TV isn’t ad supported. As shown in Figure 13, according to Nielsen, in “OTT-capable homes” streaming represented roughly 20% of TV usage in Q4 last year. Of this 20%, all of Netflix and Amazon Prime viewing is ad free, or at least 40%. Hulu has disclosed that about 30% of its subscribers are on its ad-free plans and some non-trivial portion of the “Other” category 28% is probably ad-free too. Disney+, the most successful new entrant (though not reflected in the chart), is also ad free. All in, it’s probably not much of an exaggeration to say that today half of all streaming time doesn’t generate any ad revenue at all.
Figure 13. At Least 40% of All Streaming Time is Ad Free
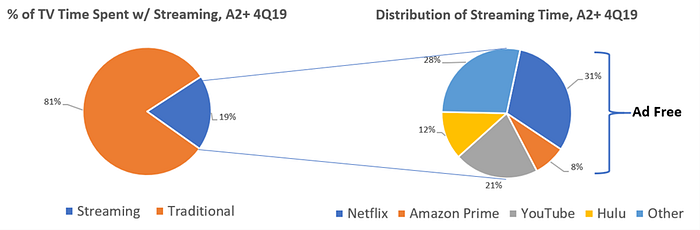
Source: Nielsen Total Audience Report February 2020
Another Angle: Streaming Monetizes Less Per Unit of Consumption
Another way to understand the likely revenue impact of this shift is to analyze how each of traditional and streaming monetize per unit of consumption. With overall viewing flat, as mentioned above (Figure 6), it’s a zero-sum game; each minute gained by streaming is a minute lost by traditional TV. As shown in Figure 14, streaming monetizes at a lower rate per hour of consumption. The implication is that the continuing shift will be a perpetual drag on industry revenue (and profit).
Figure 14. Streaming Monetizes at a Lower Rate per Hour of Consumption
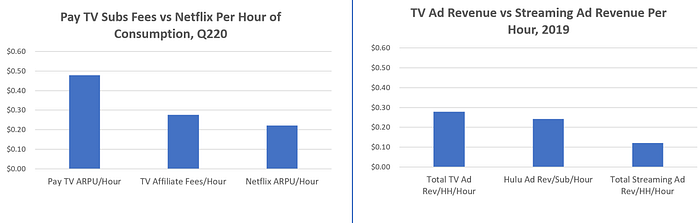
Source: Author analysis
- Netflix users are paying less than half per hour of usage as the average pay TV subscriber. People watch a lot of Netflix. The last time the company reported usage was last year, when a former executive remarked that the average subscriber watches 2 hours per day. By contrast, according to Nielsen the average household watches about 8 hours of TV per day (inclusive of streaming). With Netflix domestic ARPU at about $13 and pay TV (retail) ARPU above $90, some simple math shows that consumers are effectively paying about half per hour of Netflix what they pay per hour of traditional TV. Total affiliate fees generated per hour of consumption is also moderately higher than Netflix cost per hour.
- While perhaps half of streaming is ad-free, even the streaming services that are ad supported monetize about the same or less per minute of consumption as traditional TV. Determining ad monetization per hour of consumption is imprecise, at best. But we can make rough approximations. According to Magna, the total TV advertising market, local and national, was about $65 billion last year. Factoring in the number of TV households and traditional TV viewership per day, we can approximate that traditional TV generates about $0.30 in advertising revenue per household per hour of consumption. The best, and most generous, comparison in streaming is Hulu — it has been selling streaming TV ads the longest and has the most experienced salesforce and longest agency relationships. Hulu’s CPMs are reportedly substantially higher than traditional TV — perhaps double on a net effective basis. However, Hulu also runs less than half the ad load of traditional TV, about 9 minutes per hour compared to 22 minutes for TV. As shown in Figure 14, as a result I estimate that Hulu generates roughly the same, or slightly less, in ad revenue per household per hour as traditional TV. Even if we assume that all streaming inventory is monetized at this rate (which is probably the high-water mark in the industry), when accounting for the roughly half of streaming that is ad free, streaming generates substantially less ad revenue per hour of consumption.
Shifting the focus to costs…
Streaming Adds Opex
So far, I’ve been careful to compare the revenues that accrue directly to the TV networks companies —wholesale affiliate revenue — not the retail pay TV revenue that subscribers pay to cable, satellite and telco video distributors. While this is meant to provide insight into the revenue implications for traditional TV companies of the shift from traditional to streaming, it is an incomplete way to look at the profit implications because the shift from wholesale to direct-to-consumer doesn’t only have revenue implications, it also adds significant costs. Today, video distributors keep about 40 cents of every retail pay TV dollar and remit the other 60 cents to TV networks. Believe it or not, they actually do something in exchange for that 40 cents.
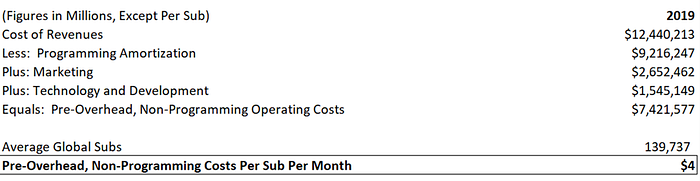
Figure 15. Netflix Non-Programming Costs are $4 Per Sub Per Month
Source: Company reports
As wholesalers, historically TV networks don’t do acquisition marketing, handle billing and payments processing, provide customer support, invest much in product, pay for cloud storage and streaming delivery, employ many software engineers, license video players, perform usage or operational analytics, etc. In 2019, Netflix spent about $4 per sub monthly on these costs (Figure 15), and Netflix is as scaled as you can get. These costs are likely significantly higher per subscriber for everyone else. With most streaming services priced at between $5–15, that means the incremental operating costs to run a streaming service — apart from the largest cost, programming — can easily chew up one-third to one-half of the monthly retail price.
Depending on the scale of the streaming service, incremental operating costs may exceed the 40% vig that the traditional pay TV distributors keep, meaning there is little or no economic advantage in cutting out the middleman.
Lower Consumer Switching Costs Help Consumers, but Also Reduce Profits
Consumer switching costs are obviously much, much lower with digital products. Since inception, the Internet has been chock-a-block with horror stories about trying to cancel cable service. Netflix, by contrast, requires three clicks.
The evidence suggests consumers are taking advantage of this lower switching cost to manage their streaming subscriptions much more actively. The last time Netflix reported monthly churn was in 2011, when churn was 4.9% monthly or 60% of the subscriber base per year. We don’t know what it is today, but let’s assume that it has declined all the way to 2% monthly, which would be pretty good. That would still mean that, between 2011 and 2019, Netflix would have had about 200 million cumulative gross adds, more than three times its current domestic sub base and twice the number of households with broadband in the U.S. So, the only possible inference is that some significant proportion of Netflix’s subscriber base consists of consumers who are actively turning the service on and off. On Netflix’s 2Q19 earnings call, Ted Sarandos mentioned that 18 million people watched the entire season of Stranger Things season 3 within four days of its release. He said it to highlight the fanaticism around the show — but it also raises the question of whether all those fervent subscribers were so fervent so they could fervently cancel service right after watching. The reported and anecdotal churn rates on vMVPD services have also been very high, tied in part to the timing of major sporting events.
So, while churn rates for facilities-based services — with their requisite truck rolls, equipment returns and, sometimes, not-so-customer-friendly cultures — haven’t necessarily changed a lot, the shift toward streaming means much lower switching costs and therefore much higher churn. It would hardly be surprising if one of the streaming video aggregators (not device-based aggregators like Apple and Roku, which generate commissions, but software-based aggregators like Reelgood, JustWatch or Yidio) eventually offers a feature to monitor streaming app usage and recommend when consumers churn on and off. Higher churn saps profits for basic reasons: to the extent consumers are no longer locked into long-term relationships with their video providers, they are paying for service for shorter periods of time (meaning, even if they habitually churn and reconnect, they are not paying during the intervening period); and there are transactional costs to re-acquire these customers.
“New” Entrants are Willing to Operate at Low (or No) Margins
No reason to belabor this either because it is also well understood, but perhaps the most damaging change to industry profits is the competitive landscape.
While Netflix is, by far, the scaled player in streaming, with over 70 million subscribers in North America and closing in on 200 million globally, it operates at significantly lower margins than traditional TV networks. Although it is set to outperform on margin expansion in 2020, it is still guiding to a 19% operating margin in 2021, consistent with its general pattern of about a 300 basis point improvement per year. Again, that is roughly half the average for cable networks. This is entirely by design. With high visibility of revenue, Netflix manages to these margins by controlling its programming expenditures. In theory, it could moderate the pace of its programming spending growth and allow margins to expand faster. But why should it? Its shareholders are clearly supportive of its spending levels. (While Disney activist Third Point is urging Disney to spend more on streaming, no one seems to be urging Netflix to spend less.) Like a poker player holding the majority of the chips, it has every incentive to keep raising the stakes and push the weaker players out.
Here’s a business axiom: if you’re trying to make money, it is bad if people enter your business who are not trying to make money.
While Netflix is willing to operate at relatively low margins, it still has to generate profits. That’s not the case for some of the largest new entrants in the video business, most of which are effectively using video margin to subsidize something else. Amazon is using Prime Video to drive Prime subscriptions, which in turn increases overall merchandise spend. Apple is using Apple TV+ to increase lock-in to its device ecosystem and encourage a general shift toward more subscription services. Neither AT&T nor Disney are new entrants, but even they can use video to drive value elsewhere. AT&T has stated that it views HBO Max in part as a tool to help reduce wireless churn and Disney likely sees Disney+ as a tool to bundle in other Disney products and services. In some cases, the opaque nature of internal transfer payments will make it very difficult for outside observers to figure out if these video efforts are profitable or not.
TV at a Tipping Point
TV is transitioning from a larger profit pool to a smaller one. Until now, the bigger one has been surprisingly resilient even as the smaller one has grown rapidly. The central premise of this essay is that the former is starting to roll over and the latter won’t be big enough to make up the difference. After 70 years of profit growth, TV is entering a period of decline.
We have seen this movie before, with music, newspapers and magazines. Each of those businesses has come out the other side, but in varying degrees of health and fundamentally changed. TV will also come out the other side. People love TV. But it will also be fundamentally changed. Some of these changes are easy to see, others are tougher to predict.
The former first:
The next 3–5 years will be difficult. It is very (very) hard for a growing business to adapt to decline. It usually plays out a similar way. The entire cost structure of the business needs to be revisited, most painfully including staffing and compensation levels. Cultures built around growing, and winning, with all the accompanying perks and prestige, will resist or deny reality as long as they can. Often, new leadership will be necessary. Painful layoffs and restructurings will ensue, such as those recently announced at Disney, NBCU, ViacomCBS and WarnerMedia. But this process is almost always iterative. It is impossible for management to cut deep enough the first time, or even the second, as they test out the new structure(s) and adjust to actual financial performance, which often differs materially from forecasts. (Forecasts are usually linear, reality is not.) Owners (whether private or public) and Boards will keep new leadership on an ever-shorter leash, sometimes leading to multiple leadership changes. These waves of restructurings and changing organizational structures, interrupted by periods of temporary stability, hinder employee productivity and morale.
There will be a shakeout of subscale networks. This is already happening, but it will accelerate. In the face of financial pressures, those network brands that are either too small or lack a sufficiently strong consumer brand to transition to direct-to-consumer will do the only things they can: cut marketing and programming. This will further damage their consumer value proposition, reducing brand equity and usage, and initiate a vicious circle. Just as many newspapers and magazines simply shut down or transitioned to diminished digital-only versions, many networks will simply shut down too.
Assets will change hands. It is telling that activists are now agitating for change at AT&T, Comcast and Disney, three companies that just a few years ago seemed far too large to be targeted. Whether from external or internal pressure, larger players will likely reassess their portfolios and shed non-core assets. Smaller traditional TV companies will seek to sell, although it isn’t obvious buyers will surface.
A changing, smaller, TV industry also raises all kinds of open questions. Here are just a few:
Will there be winners and losers? Yes, although based on a relative, not absolute, definition of “win.”
- Will Netflix win? It’s not right to write that Netflix will win, because the tense is off. It already has. The primary question, which is a big one, is the degree to which competition will constrain its margins. A secondary question is whether it ever pursues other ways to monetize its massive, highly engaged subscriber base, such as by adding advertising.
- What about Amazon? Apple? As described above, most of the largest new entrants in streaming video are using video to subsidize something else. If Amazon can successfully use Prime Video to drive higher merchandise sales, it can still “win” even if it only breaks even in video. Same idea for Apple.
- What about Disney? Similarly, if it can use Disney+ as the foundation of “Disney Prime” or “Disney-as-a-Service” to also increase merchandise sales, net theatrical receipts and theme park visits, it too can win. Whether or not its discrete video profit is higher in five years than it was in 2018 is a different question. As noted at the beginning (Figure 1), as the only traditional TV company that has a higher share of streaming than it holds in the traditional TV market, it is best positioned. And after starting at a low price point with Disney+, it could have pricing power. Even so, the net effect of streaming on video profits is largely dependent on whether, and how deftly, it shifts ESPN to D2C.
- Are there profitable niches? In theory, there are a handful of networks that have been relatively underearning within the bundle but have very high consumer affinity. For these networks, there may be an opportunity to superserve a smaller pool of highly engaged fans by going D2C and, if they have the necessary brand permission, become “omnichannel” brands by branching into merchandise, events, affiliate marketing, education, etc. This is hard to do, particularly if these networks are buried within larger network portfolios and don’t receive the right investment and focus. But it’s possible.
- Who loses? Given all these dynamics, it seems pretty clear that anyone who is subscale and solely in the video business will “lose.” An interesting question to consider is what “subscale” means. Which brings us to…
Will video be winner-take-most? Probably not — but it’s not as crazy as it sounds. Many digital businesses have proved to be “winner take most,” raising the question of whether the same may happen in video. This may seem like an odd question, given the vibrancy of the competitive dynamic. Also, the reason many digital businesses naturally consolidate to power-law type market share distributions is because of powerful network effects. Those types of network effects don’t exist in video. But the question isn’t that crazy. If you look at many analyst models for Netflix, it is on track for over 300 million global subscribers in five years, surpassing $50 billion in annual revenue. Based on its guidance for 300 basis points of operating margin expansion per year, that would imply a programming expenditure of about $30 billion in 2025. Disney is also on track to exceed $30 billion in video programming (including sports rights). Today, most of the other largest TV networks companies spend $10–12 billion per year. What happens when two players are spending $30 billion each per year? The risk is that the only programming left for everyone else is whatever those two don’t want. The big question remains whether other deep pocketed players, like Amazon and Apple, stay committed, and to what degree. How smaller players compete in this environment, and in which programming niches, is also an open question.
What happens if two players are spending $30 billion each per year?
Will sports rights finally peak? The consequences of a smaller, less profitable TV industry is unclear for sport rights. Sports is what holds the bundle together and props up affiliate fees, so traditional networks will hold on to them as long as they can. But sports rights and industry profits can’t be untethered forever. As sports rights go up, affiliate fees go up, distributors pass along these increases indifferent to the effect on subscriber counts, and more subscribers disconnect. At some point, as the economic underpinning of pay TV erodes, TV networks won’t have the will or ability to keep paying higher fees. The question, again, is whether digital platforms show up to bid. So far, they’ve only experimented.
What will marketers do? TV has been such a successful ad medium for so long because it provides mass reach relatively inexpensively. It is still very difficult to aggregate and measure similar reach using digital. What will marketers do as TV viewing continues to erode and, as prices rise, reach and efficacy decline? AVOD services stand to benefit, but these will likely remain too small to solve the problem.
What happens to demand for independent producers? The “second golden age of TV” has been a boon for content producers as money has flooded into the market. However, the largest streaming providers are now moving an increasing proportion of their budgets to in-house productions. And a Disney/Netflix duopsony (a market with only two dominant buyers), while hardly a foregone conclusion, would ultimately reduce independent producers’ bargaining power. Once again, the answer depends in large part on who stays in the market, and to what degree.
The traditional TV companies rushing headlong into streaming, which is to say pretty much all of them, are doing the right thing and for the right reasons. They have no choice. But they are ultimately fighting for share of a shrinking pie. The TV industry is likely to change radically as a result.